Three’s a Party: YOY Trends for Independent Work
In the third year of sharing the financial state of my business I look at year over year trends.
Andy Warhol has been famously quoted that, “one’s a company, two’s a crowd, and three’s a party.” For Jono, LLC there is one in the company: me. The twos are my clients. I cannot exist without them as we will see in this year’s findings. And, three marks the years that I have been sharing the financial state of my business in this newsletter. Today, I will share this past year’s numbers. Then, for the first time, I will look at — what I hope to be — trends that I can continue to log and analyze for a long time.
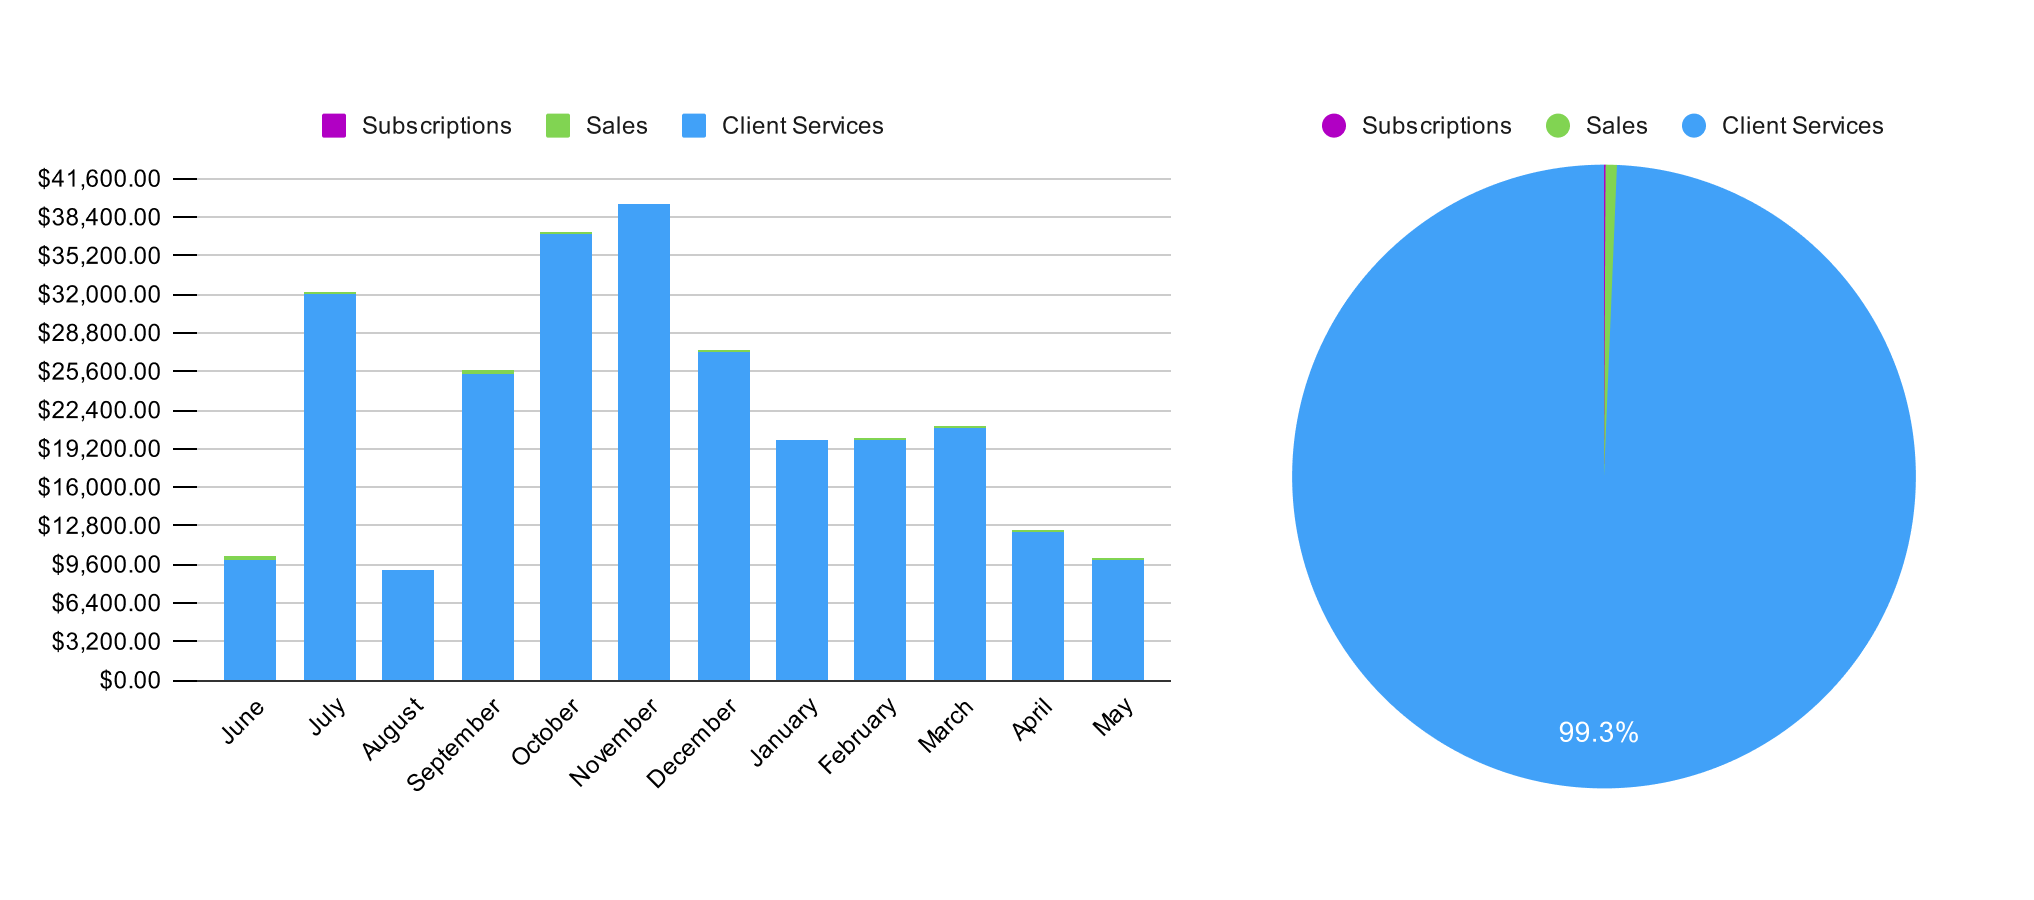
Like past years, this year’s income is predominantly earned through working with my clients. Unlike previous years, however, cashflow has been more consistent. I would like to say that has to do with better planning, but I forgot to heed my own advice from Year 1 and took on too much work in the fall. While I discovered I work best with no more than 3 clients in that first year, I learned this year that it is important to have a mix of short term projects (1 – 3 months) and longterm projects (1+ years). This kept things (both income and creativity) flowing even when my workload was inconsistent. The commit history for the past year (below) reveals how erratic creative independent work is.
If I had to generalize for technology, advertising, and cultural industries, it would be that spring and fall tend to be the most active periods. I always thought this to be the case because conferences, announcements, and spending budgets are all decided, released, or set at these times. But, this year’s commit output (a loose approximation of my workload) is most busy in the summer (and again in February). Perhaps this is an anomaly. Perhaps this is the opportunity of an individual contributor to larger projects. What I can say for certain though are that there are trends starting to form in my business practices:
Over the last three years income earned from my client work has slowly increased. At first glance it makes sense given various economic circumstances. However, my prices have not changed since I started in 2020. I attribute this to learning how to be more effective as an individual contributor. This means both becoming more efficient in my use of time and being more articulate in communicating expectations and output with clients. I believe it benefits everyone. On top of that, I certainly feel more confident today than when I started working on my own.
Other trends worth noting are the hump of sales and the sophomoric slump of subscriptions. As a refresher, sales constitute everything sold on my Shop and downloads from the App Store. Subscriptions are supporters of my Open Source efforts on Github:
These categories are more or less my personal output where I have more freedom to explore what I make and how I make it. I incubate a lot of ideas around how to be a more effective contributor here. What tools, workflows, and set ups will be beneficial to make me more effective as a contributor for my clients.
Lastly and a bit surprisingly, my commit output (the line chart above and to the right) has declined for both personal and commercial endeavors over the last three years. This, I believe, is the result of being a more effective contributor. Earlier in my career I would make commits for every change. But, now I am more tactical in how and when I commit work to repositories. This does not mean I work less. Just that my practice has shifted to make more smaller prototypes where work is less tracked. When I am clear on the direction and purpose, I then commit that work where it is tracked.
As always, you can find all the data in this spreadsheet. If there is anything I learned from looking at these numbers, it is that I should prepare for a busy summer! Strike while the iron is hot,
—Jono


